
lldb - the llvm debugger
C++ debugging basics
A debugger allows to intervene in a program, to continue or to examine variables at a breakpoint or watchpoint. For example, to fix a seqfault of the program. The program must be compiled with debug symbols.
Start lldb program-name or run lldb and create a target create program-name.
to start the program in lldb:
process launchor aliasrun,r- or connect it to a process by process id or process name.
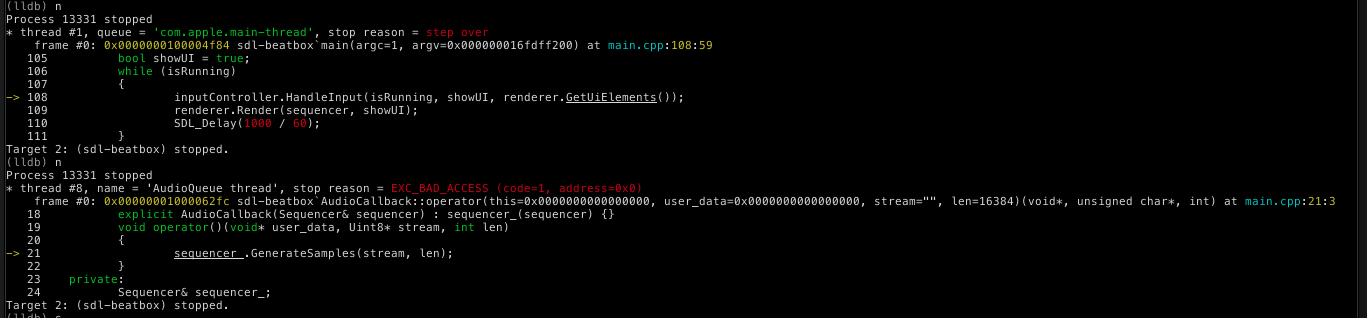
When it is running:
sstep intonnextffinish
helpbtbacktrace
Interactive debugging
Example using lldb for a program called sdl-beatbox with CMake.
CMake ensures that the program is built with -g for lldb or gdb.
mkdir Debug && cd Debugcmake -DCMAKE_BUILD_TYPE=Debug ..makelldb sdl-beatbox- breakpoint example
b main- on symbol:
b Au<tab> - or on line:
set breakpoint -f <filename> -l <line number>orb sequencer.cpp : 43
- on symbol:
rto launch.
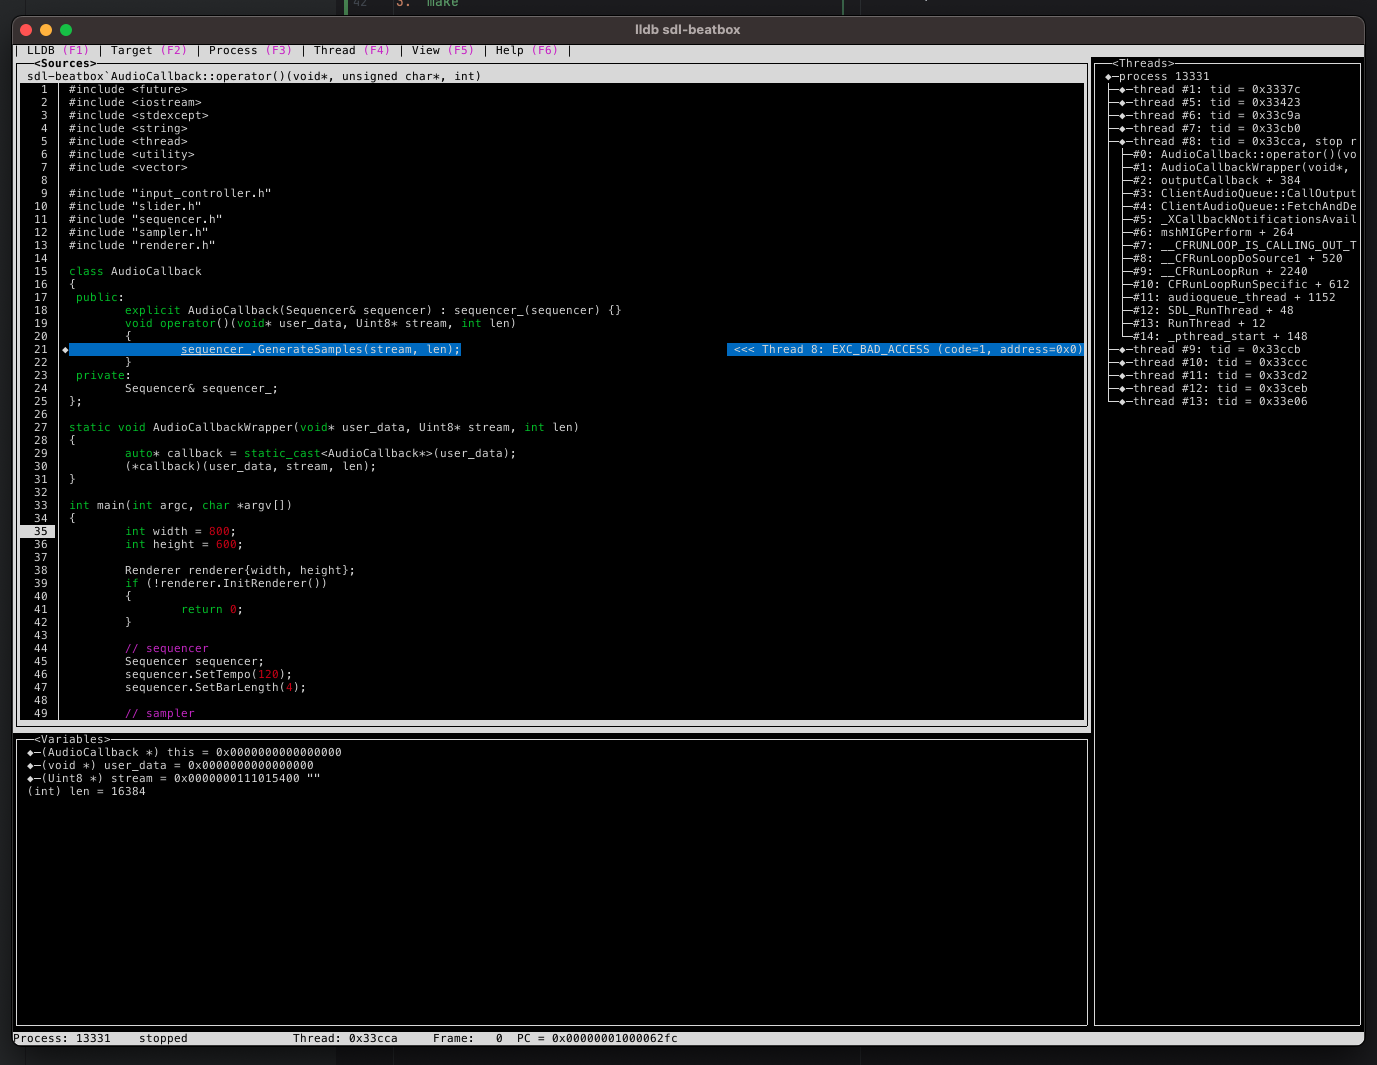
lldb gui
In the lldb session, gui leads to the graphical user interface.
In the gui, a diamond shows the current line and allows navigation with arrow keys and checking the status.
Links
Written on June 3, 2023